Adherence to laws, regulations, and guidelines is vital for ensuring life sciences companies’ safety, efficacy, and ethical conduct.
Even though life sciences companies are determined to bring breakthrough innovations to the market, complying with all applicable laws and regulations seems to be an imperative that cannot be disregarded.
With the rising complexity of compliance functions and processes, harnessing the power of data visualization has become essential for navigating through the intricacies and achieving a robust compliance framework or program.
With the compliance data visualized to make it easier for compliance professionals to derive actionable insights, compliance professionals and life sciences organizations can augment compliance capabilities – moving from hindsight to foresight.
Let’s explore the utilization of data visualization in the life sciences industry and see how it can ensure compliance with regulatory requirements.
The Life Sciences Compliance Landscape
Compliance functions are deeply ingrained in every facet of the industry, from research and development to manufacturing, marketing, and distribution. Compliance ensures that products are safe, effective, and meet the required quality standards.
Navigating this landscape involves understanding and adhering to rules and regulations such as the Anti-Kickback and Fraud and Abuse Laws, the Physicians Payment Sunshine Act, and more that govern the life sciences industry.
For every law that governs the life sciences industry, there’s a requirement set forth for organizations to ensure compliance with the specific law.
Where proactive compliance with the regulations in the life sciences industry can yield numerous advantages, non-compliance can have profound implications, such as reputational damage or financial repercussions in the form of significant fines and penalties that can substantially impact an organization’s profitability and resources, diverting funds from critical research, development, and other growth initiatives.
Visualizing compliance data helps a clearer understanding of these regulations and their implications on operations and strategies. It enables compliance professionals to evaluate data to identify and prioritize remediation of compliance risks.
Key Factors Impacting Life Sciences Compliance
Several factors contribute to the complexity of compliance in the life sciences industry:
-
Regulatory Diversification: Different regions have unique regulatory frameworks, making it crucial to comprehend and comply with each jurisdiction’s requirements.
-
Rapid Technological Advances: Evolving technologies often outpace regulatory updates, posing a challenge to ensuring compliance in emerging areas such as artificial intelligence and genomic research.
-
Data Volumes and Complexity: The industry generates massive amounts of data from clinical trials, research studies, and manufacturing processes. Analyzing and interpreting this data for compliance purposes can be overwhelming.
Data Visualization: The Key to Interpreting Compliance Data
Data visualization involves presenting data in a graphical or pictorial format to enable easier understanding and interpretation.
It holds immense potential for addressing compliance challenges and enhancing compliance program capabilities by allowing compliance professionals to derive actionable insights from their organization’s compliance data for effective monitoring.
Moreover, compliance professionals can track and analyze compliance data effectively through visualization, enabling them to identify key risk areas and mitigate them promptly to ensure adherence to applicable laws and regulations.
Another critical advantage that demonstrates the importance of data visualization is that it reduces the effort required to make sense of compliance data.
The simplification of complex data allows compliance professionals to proactively manage compliance risks, enhance operational efficiency, and make informed decisions to ensure adherence to industry regulations and standards.
Harnessing The Power of Data Visualization
As discussed earlier, the power of data visualization lies in its ability to make it convenient for compliance professionals and life sciences organizations to evaluate the massive amounts of data being generated.
Through visual representation, they can pinpoint anomalies and discrepancies, identify the root cause of risks, and mitigate them promptly to ensure compliance. In the long run, this continual improvement of compliance allows you to improve the maturity level of your compliance program from ‘reactive’ to ‘holistic.’
However, to derive value from your compliance data while mitigating risks before they escalate to critical levels, you would require a data-driven compliance platform to augment the capabilities of your compliance program, maximizing effectiveness and efficiency.
Advantages of Data Visualization
-
Enhanced Insights and Decision-Making: Interactive visualizations provide compliance professionals with real-time insights into data, enabling informed and timely decision-making. Trends, patterns, and anomalies become apparent, aiding in risk assessment and mitigation.
-
Simplified Reporting and Auditing: Visualization tools streamline the reporting process, making it simpler for compliance professionals to compile compliance reports and present findings to regulatory authorities during audits.
-
Identifying Non-Compliance Activities: Visualizing data over time helps identify recurring instances of non-compliance, enabling proactive measures to rectify issues and prevent future occurrences.
-
Streamlined Communication: Visual representations of compliance data facilitate clear and effective communication among different stakeholders, including compliance teams, executives, and regulators.
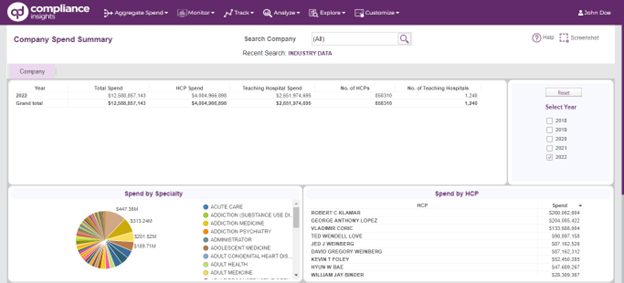
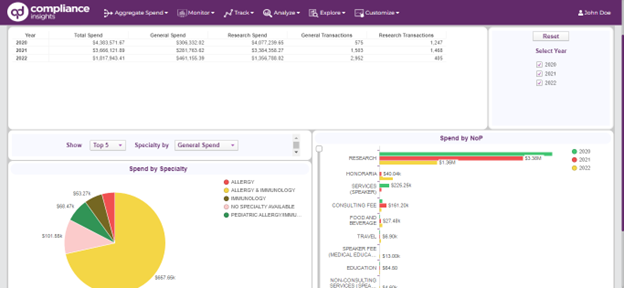
The Role of Impactful Dashboards in Data Visualization
Data-driven dashboards play a critical role in analyzing and evaluating compliance data. These purpose-built dashboards allow quick and simple representation of complex data to derive insights, present to stakeholders, and make quick and well-informed decisions.
qordata’s data-driven compliance solutions, such as Compliance Monitoring & Aggregate Spend Reporting, offer dashboards that simplify the process for compliance professionals to derive actionable insights from data, aiding in effective regulatory reporting. Here’s a blog that discusses the role of impactful dashboards in data visualization.
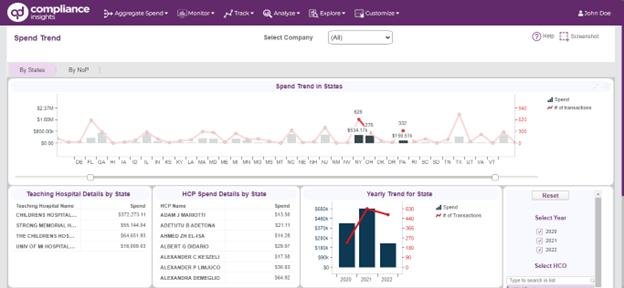
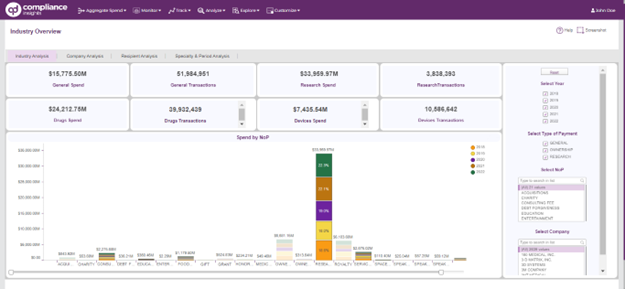
Using Charts & Graphs to Communicate Compliance Insights
Utilizing charts and graphs effectively can enhance the communication of compliance insights to key stakeholders. Visual representations such as pie charts, histograms, and scatter plots can simplify complex compliance data, making it understandable for all stakeholders.
However, this approach would require effort because you will prepare the charts and graphs manually. The process would also take time, depending on the data you have to represent. To minimize these challenges, leveraging a Compliance Analytics platform for data visualization is the best way forward.
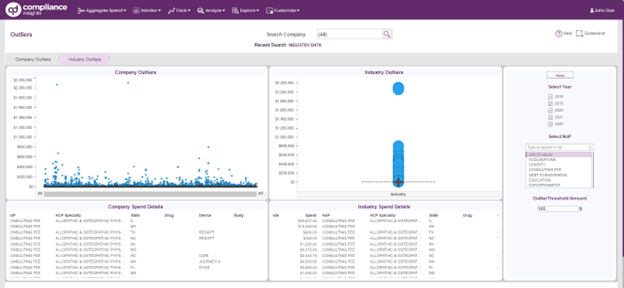
With solutions offering interactive risk-based dashboards, insightful representation of industry data, and the ability to spot outliers, anomalies, and more, compliance data visualization would become easily achievable, and the risk of errors would be reduced significantly.
To Conclude
In the growing age of complexity, data visualization emerges as a pivotal tool to achieve compliance in the life sciences industry. By effectively harnessing visualization techniques, compliance professionals can navigate the intricate regulatory landscape, address compliance risks, and optimize processes.
With data visualization, compliance functions can transition from reactive to proactive, ensuring a resilient compliance program. Embracing data visualization technologies and integrating them into compliance processes can pave the way for a more efficient, transparent, and compliant life sciences industry.
Moreover, data visualization is an invaluable asset for compliance professionals in the life sciences industry, offering a clearer perspective on compliance data. As the industry continues to evolve and face new challenges, leveraging data visualization will become increasingly essential in upholding regulatory standards and achieving compliance objectives.